GoldenCross
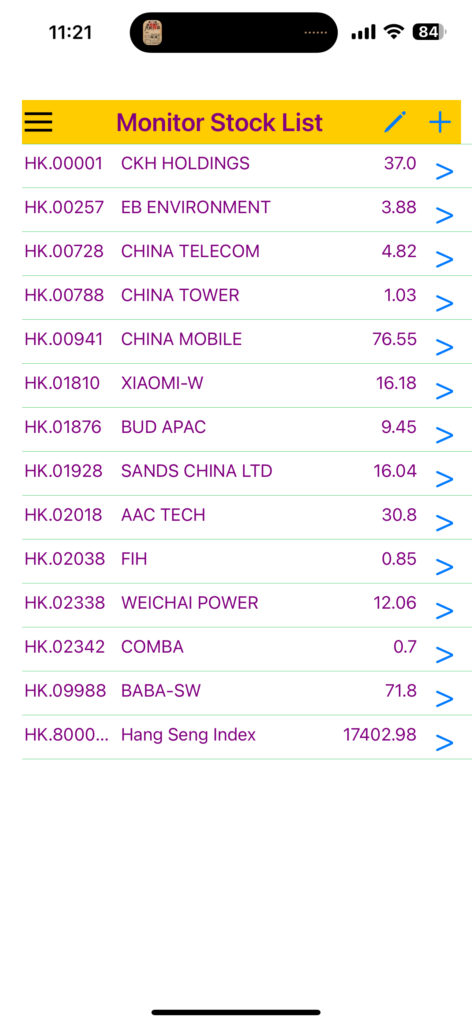
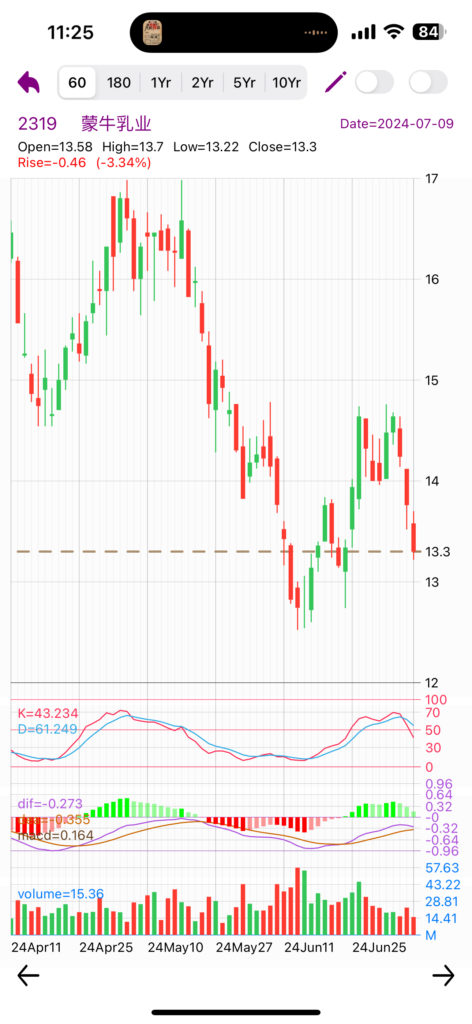
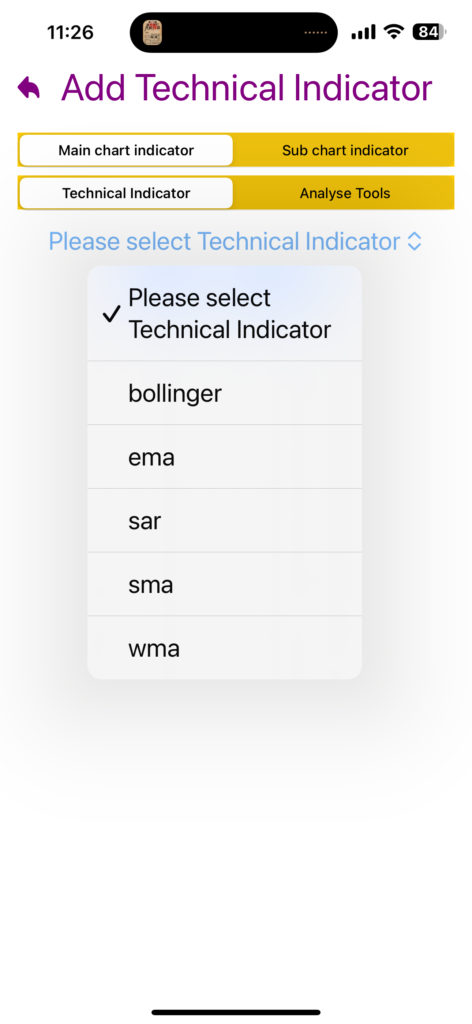
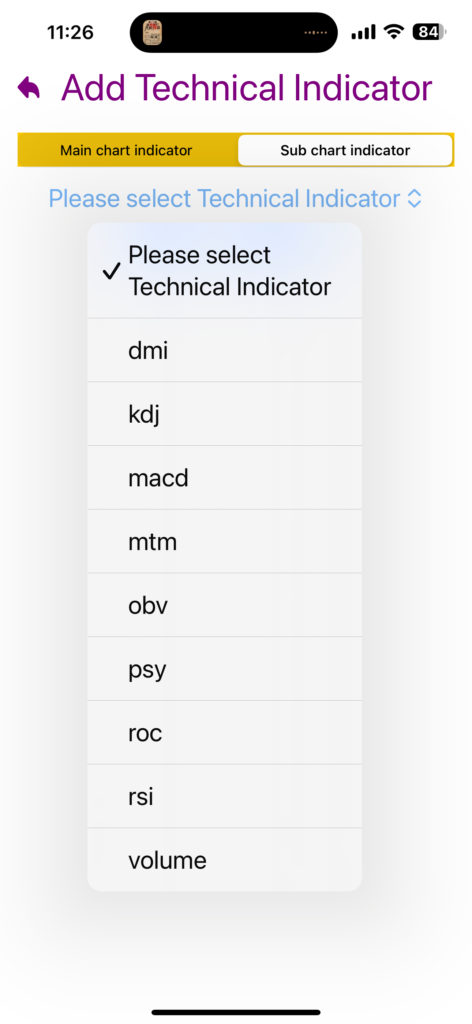
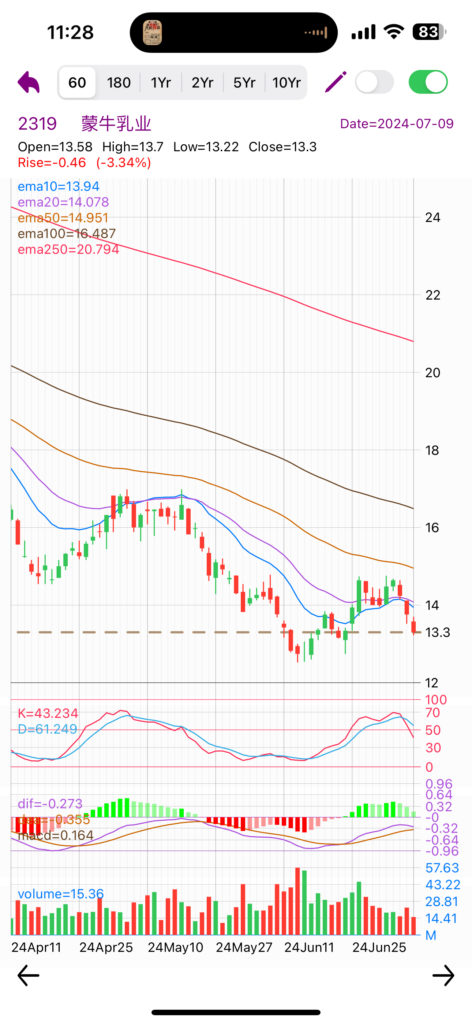
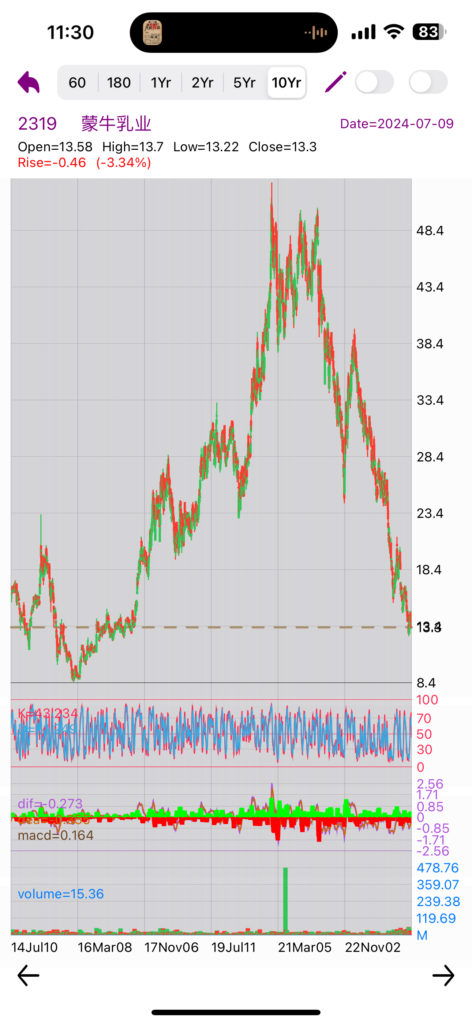
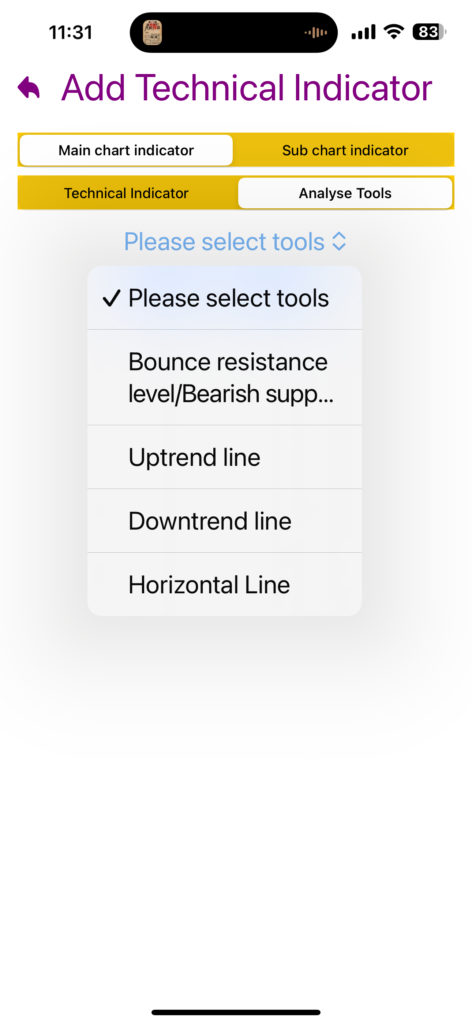
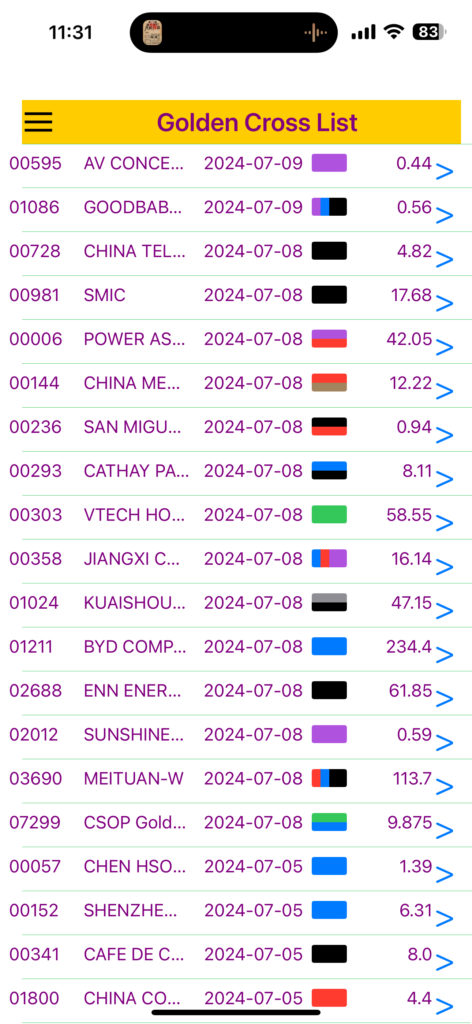
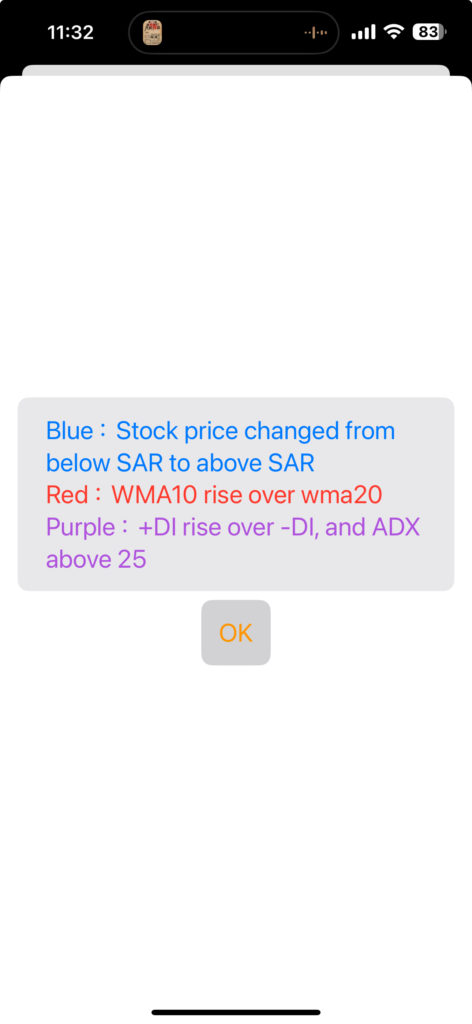
The golden cross is an important tool in stock technical analysis. It provides a long-term candlestick chart spanning ten years and assists in using various technical indicators, such as SMA, EMA, WMA moving averages, SAR parabolic indicator, DMI trend indicator, KDJ stochastic indicator, MACD, RSI, MTM, OBV, PSY, ROC, and trading volume. In addition, the golden cross offers multiple chart interpretation tools, including resistance levels, support levels, upward trendlines, downward trendlines, and horizontal lines. The system automatically analyzes the selected stocks. If a stock encounters significant bullish indicators, such as the morning star, bullish moving average crossover, KD line golden cross, +DI-DI golden cross, MACD crossing above the zero axis with fast and slow lines, or stock price transitioning from below SAR to above SAR, it adds all favorable stocks to the golden cross list for further analysis.